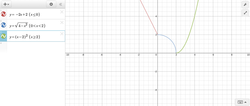
The equation y=x2, you have to find the inverse to it, so you square root both the y and x to get rid of the 2. By square-rooting your final equation for the inverse function would +/- square root of x equals y. 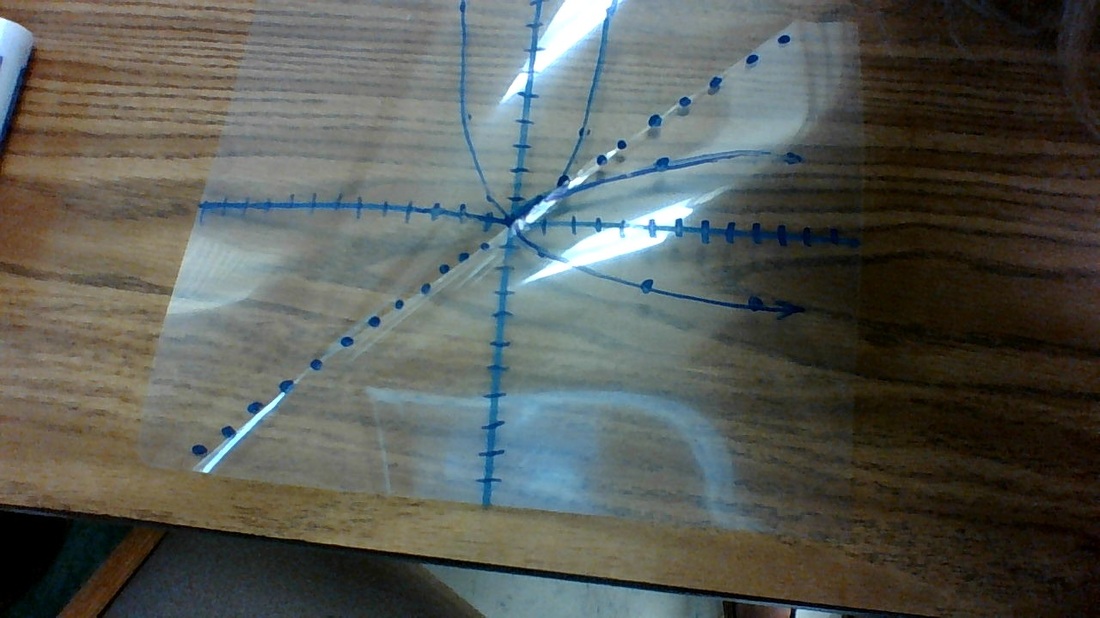
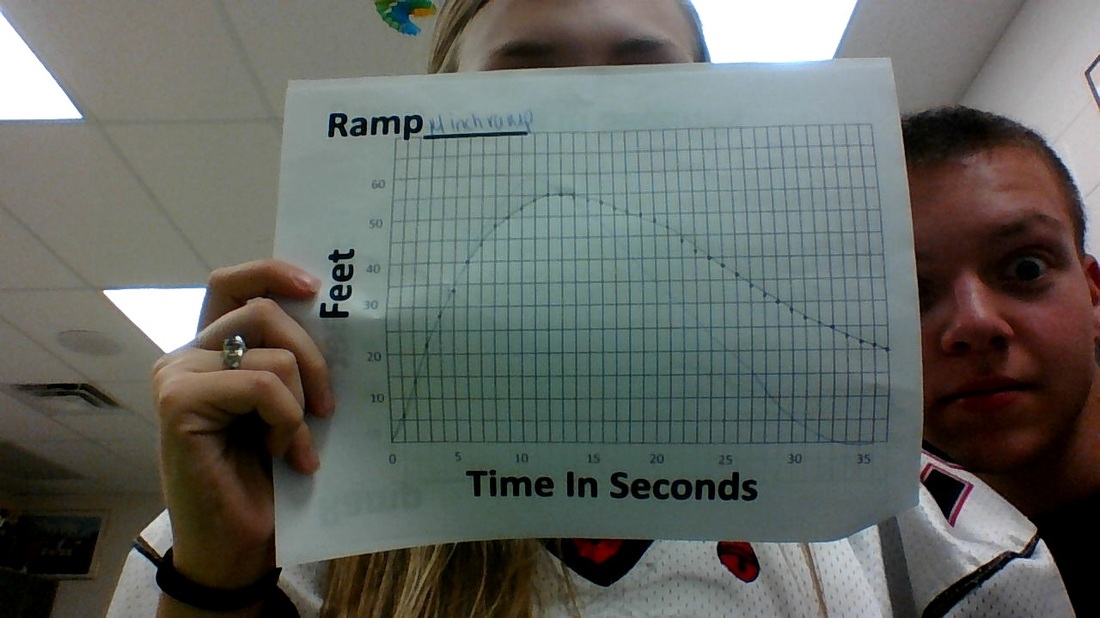
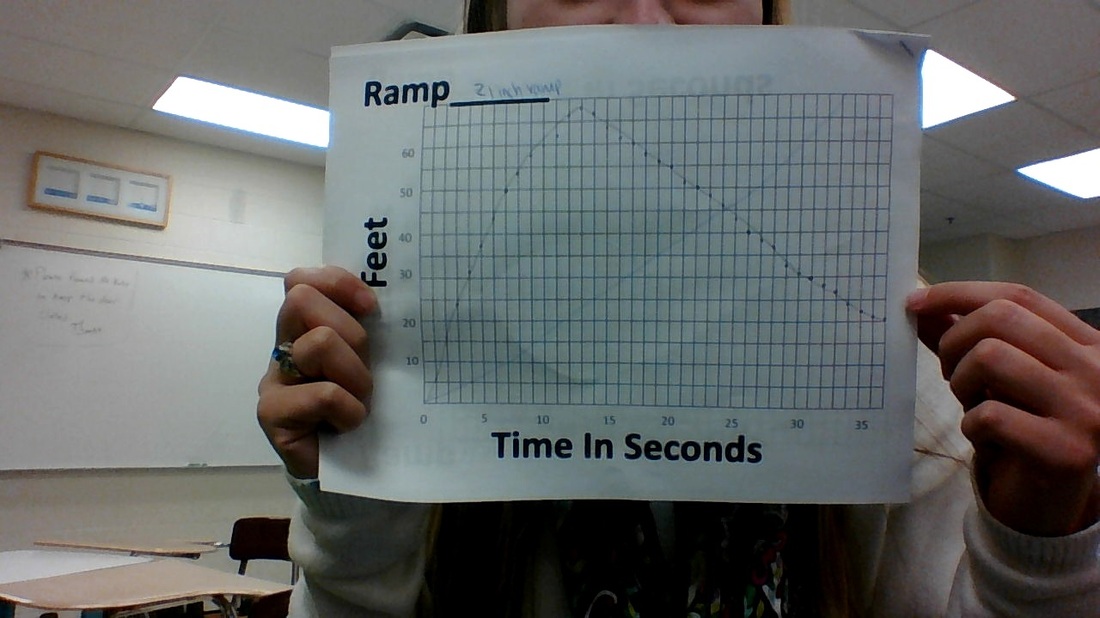
1. My first drawing was completely different then what the actual graph looked like. After the next couple of graphs my first attempts compared to what they really were was a lot closer. The last one was different because I continued to go with the graph downhill and the video stopped with the graph halfway, the skateboard didn't continue to go back down. I thought the skateboard would increase it's speed quickly from going down a ramp so fast but it did a casual increase of speed. 2. The domains and ranges represented where the skateboard started to go down the ramp and its speed increasing, and it also represented the skateboard slowing down and going back down the skateboard. 3. The first graph was the skateboard going offa of a 21 inch ramp, a 14 inch ramp, and a 7 inch ramp so the maximums and minimums would be different because the skateboard was going from different heights and different speeds. 4. The graph is rising the fastest when the skateboard has reached its maximum speed and also went the furthest and also the skateboard would start to go forward a ways. When the graph is falling it means that the skateboard is reaching its lowest speed and then the skateboard would start to go backwards. 5.
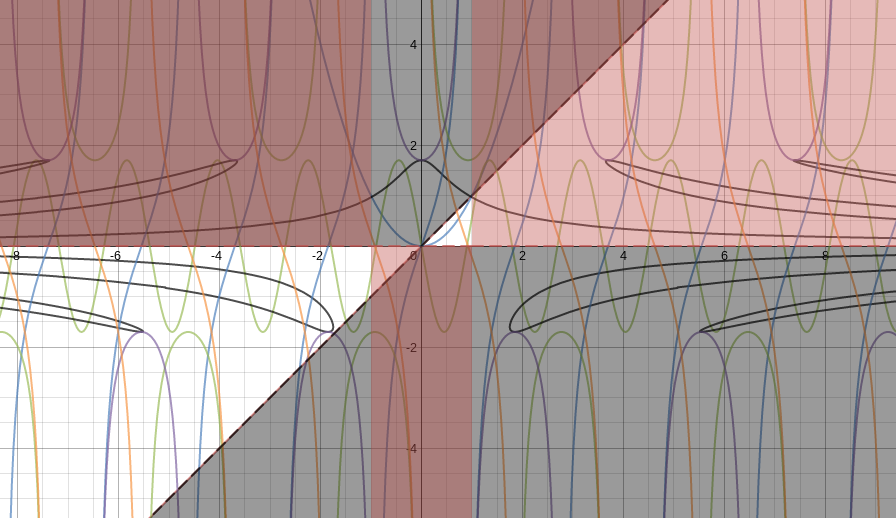
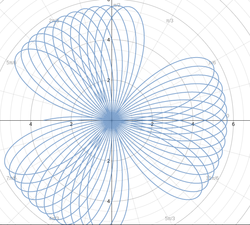
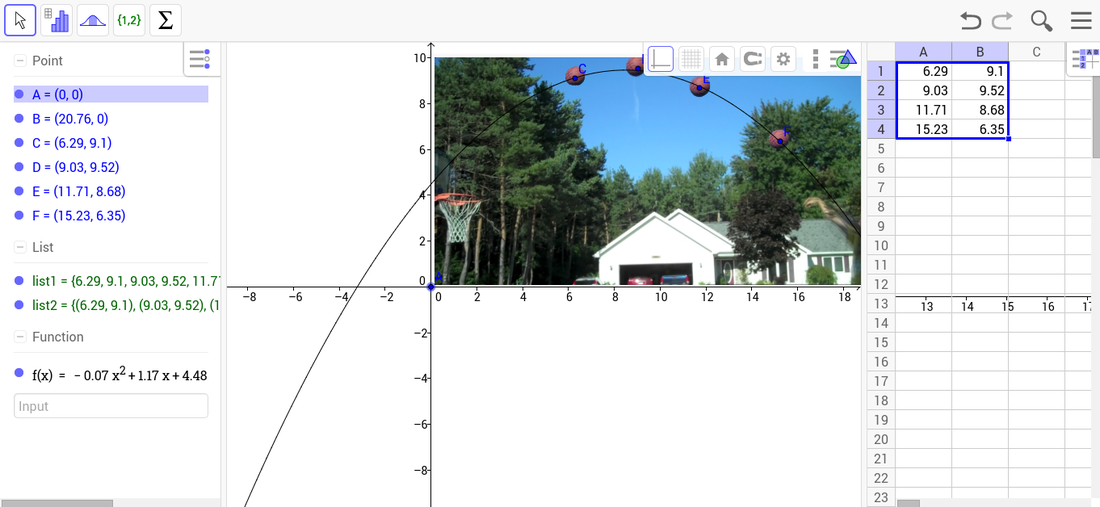
In this art function project I used very many functions. Different functions made different lines and also shading. I used the the Quadratic Function, the Sine and Cosine Function. Besides using functions that we were given to copy down, I just made some random functions up and used different colors. I honestly don't know how I got the black lines that come from the sides of the graph but it is very cool looking.
| AuthorWrite something about yourself. No need to be fancy, just an overview. ArchivesCategories |

 RSS Feed